Line chart with one or more series, a vertical value scale with round-numbered grid lines, optional reference lines, and an optional card frame with a title and a footer line.
More...
|
| | LineChart ()=default |
| |
| | LineChart (Bounds bounds, const char *title=nullptr) |
| |
| void | setTitle (const char *title) |
| |
| void | setFooter (const char *footer) |
| | One line of text below the plot, e.g. a summary of the values.
|
| |
| int | addSeries (RGB_T color, uint8_t width=2) |
| | Adds a series and returns its index.
|
| |
| int | seriesCount () const |
| |
| void | setSeriesLabel (int index, const char *label) |
| |
| void | setSeriesDashed (int index, bool dashed) |
| | Draw the series dashed.
|
| |
| ChartSeries< RGB_T > & | series (int index) |
| |
| void | setValues (int index, const std::vector< float > &values) |
| | Replaces the values of the series index.
|
| |
| void | setValues (int index, const float *values, size_t count) |
| |
| void | addValue (int index, float value, size_t maxPoints=0) |
| |
| int | addReferenceLine (float value, RGB_T color, bool dashed=true) |
| | Adds a horizontal reference line and returns its index.
|
| |
| void | setReferenceLine (int index, float value) |
| |
| void | setYRange (float minValue, float maxValue) |
| | Fixes the value range of the Y axis.
|
| |
| void | clearYRange () |
| | Goes back to an automatic Y range.
|
| |
| void | setGridCount (int count) |
| | Approximate number of grid lines of the automatic scale (default 4).
|
| |
| void | setGridValues (const std::vector< float > &values) |
| | Uses exactly these grid values (labelled) instead of the automatic ones.
|
| |
| void | setVisiblePoints (int count) |
| |
| void | setXAxis (float first, float last, int ticks=3, AxisFormatter format=nullptr) |
| |
| void | clearXAxis () |
| | Removes the X axis labels.
|
| |
| void | draw (tinygpu::ISurface< RGB_T > &target) override |
| |
| virtual | ~Widget ()=default |
| |
| virtual void | setTheme (const MaterialTheme< RGB_T > &theme) |
| |
| virtual void | draw (tinygpu::ISurface< RGB_T > &target)=0 |
| |
| virtual bool | onGesture (const tinygpu::GestureEvent &event) |
| | Handles one gesture event. Returns true if this widget consumed it.
|
| |
| virtual bool | update (uint32_t nowMs) |
| |
| virtual bool | isDraggable () const |
| |
| virtual bool | isDraggableAt (int32_t x, int32_t y) const |
| |
| virtual int | childCount () const |
| |
| virtual Widget< RGB_T > * | child (int index) |
| |
| virtual void | drawBackground (tinygpu::ISurface< RGB_T > &target) |
| |
| virtual void | setThemeTint (RGB_T background, RGB_T foreground) |
| |
| virtual bool | isContainer () const |
| | Provides true if the widget is a container.
|
| |
template<typename RGB_T = TINYMD_DEFAULT_RGB_T>
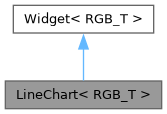
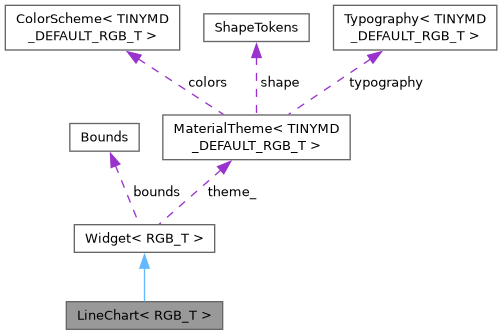
class tinymd::LineChart< RGB_T >
Line chart with one or more series, a vertical value scale with round-numbered grid lines, optional reference lines, and an optional card frame with a title and a footer line.
LineChart<RGB565> chart(Bounds(8, 8, 224, 140), "Temperature"); int s = chart.addSeries(colorFromHex<RGB565>(0x06B6D4)); chart.addReferenceLine(25.0f, colorFromHex<RGB565>(0xF59E0B)); chart.setValues(s, readings); // std::vector<float> screen.invalidate(); // data changed outside a gesture
Y axis: automatic (the range of all visible values, snapped outward to a 1/2/5 x 10^n step - see setGridCount()) or fixed via setYRange(); the grid values can also be given explicitly via setGridValues().
X axis: by default the points of each series are stretched over the full plot width. setVisiblePoints(n) instead gives every point a fixed spacing of width / (n - 1) with the newest point at the right edge - a rolling "oscilloscope" trace that scrolls in from the right as points are added.
Series with more points than the plot has pixel columns are drawn as a min/max envelope per column, so peaks are never lost however many points there are. All drawing goes through clipped primitives, so the chart works inside a scrolling Container.
 Public Member Functions inherited from Widget< RGB_T >